
Simran Karki is an experienced SOC Analyst who has been working in defensive security for over 2 years.She has consistently …
Threat Hunting with Windows Event Logs
Table Of Contents
Introduction
Event logs are a fantastic way to spot potential attacks on a Windows Machine and be able to explain what and how it occurred. However, not all event logs are useful, even if there are lot of them. It can be intimidating and requires good eyes to read through these logs.
This blog will explain why some event logs are more useful than others and how to use them. <![endif]–>
Event log structure in windows
The Windows event log captures hardware and software events that take place on a Windows operating system. It helps network administrators in keeping an eye out for threats and issues that could harm performance. Windows maintains event logs in a standardized format that makes it possible to understand the data. The following are an event log’s primary components:
Log name: Name of the event log to which events from different logging components will be written. Events are commonly logged for system, security, and applications.
Event date/time: Includes the date and time when the event occurred.
Task category: Identifies the type of recorded event log. Application developers can also define task categories to serve as extra information about the event.
Event ID: This Windows identification number helps network administrators uniquely identify a specific logged event.
Source: Name of the program or software causing the event log.
Level: Event level represents the severity of the recorded event log. These include information, error, verbose, warning, and critical.
User: Name of the user who logged onto the windows computer when the event occurred.
Computer: Name of the computer logging the event.

Windows event logs are stored under:
C:\Windows\System32\winevt\Logs
Each event has an event ID and is written on the channels of the event log. Common channels include:
- Security
- System
- Application
There are 4 different types of channels:
- Analytic
- Debug
- Operational
- Administrative
About Tools
Considering tools, Microsoft has an event viewer for static analysis of event logs, but I don’t suggest using it because it makes it difficult to develop sophisticated filters. You have two wonderful options: PowerShell, which offers simpler filtering, and out-grid view, which provides a GUI. Additionally, there is a for-profit product called Event Log Explorer.
You must use your SIEM to produce visualizations for each of these and add them to a dashboard for dynamic analysis in an enterprise.

Logon Activity
Your login information will be stolen and used by adversaries. We can see successful authentication and logoff, event IDs 4624 and 4634. A field named logon ID is present in these events. When a logon and logoff event have the same logon ID, the session length can be determined. It is important to whitelist built-in DWM and UMFD (Desktop Windows Manager & User mode Font Driver) logons while analyzing 4624 events as this would greatly reduce noise.
A significant number of failed logon attempts—4625—indicate brute force activity. Successful logons in great numbers indicate lateral movement activity. Event 4648 records other credentials when they are used for various tasks like process creation, network sharing, RDP, etc. However, we also need to be aware that this event may possibly generate false positives that need to be whitelisted. We can identify user logons with admin-level access by using the 4672 and 4624 commands. We should whitelist default Windows accounts like SYSTEM when watching these events. Event 4720 will identify any new accounts that adversaries create. The field labelled “logon type” in the logon event contains information on how the logon took place.
Groups
Accounts may be added by adversaries to groups with administrative authority. These events can be used to keep an eye on the groupings. The important event id to be monitored for such events are as follows:

| Event ID | Description |
|---|---|
| 4728 | A member was added to a security-enabled global group |
| 4732 | A member was added to a security-enabled local group |
| 4756 | A member was added to a security-enabled universal group |
Account Logon
Previously, I have already explained about logon, but account logon and logon are two different things. Account Logon refers to third-party authentication, whereas Logon refers to local login activity that takes place on the local system and the log is generated there. Users must authenticate to the domain controller in an enterprise domain, and as a result, both the domain controller and the local system generate logs. Account Logon events is generated on the local system if we log in with a local account.
NTLM and Kerberos are the two methods of authentication available in a corporate environment. Adversaries often use the pass-the-hash (PtH) method, which makes advantage of NTLM. In this scenario, 4624 event id and logon type 9 or 3, Event ids 4648, and 4672 will also be observed along with 4776.
Important Event IDs:
| Event ID | Description |
|---|---|
| 4776 | The computer attempted to validate the credentials for an account |
| 4768 | A Kerberos authentication ticket (TGT) was requested |
| 4769 | A Kerberos service ticket was requested |
| 4771 | Kerberos pre-authentication failed |
Enumeration
These events can allow us to detect reconnaissance activity in the network. We need to whitelist mmc, services, taskhostw, and explorer.
Powerview and Bloodhound are tools that adversaries use to enumerate privileged users and groups. We can use these events to detect who is running what process to enumerate the privileged users and groups.
Important Event IDs:
| Event ID | Description |
|---|---|
| 4798 | A user’s local group membership was enumerated |
| 4799 | A security-enabled local group membership was enumerated |
Remote Desktop Connection (RDP)
RDP is one of the many ways adversaries might roam in our environment. RDP generates the events 4778 for session reconnect and 4779 for session disconnect. Not only that, but RDP is also related to standard logon 4624 types 7 and 10. It must be emphasized that 4778 only records reconnections; fresh connections are not recorded.
Important Event IDs:
| Event ID | Description |
|---|---|
| 4778 | A session was reconnected to a Window Station |
| 4779 | A session was disconnected from a Window Station |
Network Share
To move throughout the environment laterally, network shares can be mounted to share types such as C $, ADMIN $ , and IPC $. A share’s access event 5140 is recorded, but it might not contain all the details we need; therefore, we can also use the considerably verbose event 5145.
Important Event IDs:
| Event ID | Description |
|---|---|
| 5140 | Network share was accessed |
| 5145 | Shared object accessed |
Schedule Tasks
Persistence is very important to adversaries and scheduled tasks are one way they maintain persistence. When an adversary creates a new scheduled tasks 4698 and 106 are triggered.
Important Event IDs:
| Event ID | Description |
|---|---|
| 4698 | Scheduled Task Created |
| 4699 | Scheduled Task Deleted |
| 4700 | Scheduled Task Enabled |
| 4701 | Scheduled Task Disabled |
| 4702 | Scheduled Task Updated |
We can also investigate the Task Scheduler channel through the event given below:
| Event ID | Description |
|---|---|
| 106 | Scheduled Task Created |
| 140 | Scheduled Task Updated |
| 141 | Scheduled Task Deleted |
| 200 | Scheduled Task Executed |
| 201 | Scheduled Task Completed |
Services
Services can be heavily targeted by adversaries for different purposes. If an adversary breaks a service when exploiting it, event 7034 is triggered. If adversaries use services for persistence and install a new service, events 7045 and 4697 will record it.

Important Event IDs:
| Event ID | Description |
|---|---|
| 7034 | Service crashed |
| 4697 | A new service was installed on the system |
| 7045 | A new service was installed on the system |
| 7040 | Start type changed |
| 7036 | Service started or stopped |
Note: PsExec is a light-weight telnet-replacement that lets you execute processes on other systems, complete with full interactivity for console applications, without having to manually install client software. Hackers have been using PsExec in their attacks for a long time. Ransomware gangs adopted it to deploy file-encrypting malware. In an attack that lasted just one hour, NetWalker ransomware used PsExec to run their payload on all systems in a domain.
PowerShell
We are unable to prevent the usage of PowerShell by adversaries in our networks, as PowerShell v5 has a variety of logging features. Obfuscation with PowerShell is a common technique used by adversaries to get around security systems. Script block logging will record it and it might automatically decode it as well.

Important Event IDs:
| Event ID | Description |
|---|---|
| 4103 | Module Logging |
| 4104 | Script block Logging |
WMI
Like PowerShell, which gives you access to various functions, WMI does the same. The Consumer Filter binding will be used by adversaries to achieve their goal. Various event logs are used to record their actions as they proceed through these processes, but in conclusion, 5861 will provide the best view of what happened.
Important Event IDs:
| Event ID | Description |
|---|---|
| 5857 | WMI Activity was detected |
| 5858 | WMI errors detected |
| 5859,5860 | WMI Filter/Consumer activity was detected. |
| 5861 | WMI FilterConsumer Binding was detected |
Removable Devices
These events let us track malicious BYODs, internal users exfiltrating sensitive information and intruders physically attacking the environment.
Important Event IDs:
| Event ID | Description |
|---|---|
| 4663 | An attempt was made to access an object |
| 4656 | A handle to an object was requested |
| 6416 | A new external device was recognized by the System |
Log Clearing
Log clearing that really is legitimate may occur, but it may also be a part of your baseline. Log clearing that appears to be occurring at random times should be investigated using 112 and 104.
Important Event IDs:
| Event ID | Description |
|---|---|
| 1102 | The audit log was cleared |
Under the System channel look for
| Event ID | Description |
|---|---|
| 104 | The audit log was cleared |
Detection
Threat hunting is the process of actively looking for cyber threats within a company or network. A threat search might be conducted to address a security problem or to find fresh, unknown threats or breaches. Threat hunting requires access to security data from all places across the organizations, which dynamic analysis tools can provide.
I have already mentioned static and dynamic analysis tools for threat hunting in the previous section. Now in this section, we will discuss the dynamic analysis tool (SIEM) in detail. In SIEM, we can add visualizations of all the events mentioned above to detect the threats. Now, I will explain how we can detect suspicious activities through our own in-house SIEM “SayCure”. Before drilling down the use cases. Let me introduce you to SayCure SIEM.
About SayCure
SayCure is an in-house SIEM (Security Information and Event Management) solution that provides organizations with real-time visibility into their security posture. This system collects, stores, and analyzes large amounts of security-related data from various sources within the network, such as firewalls, intrusion detection systems, and servers. With SayCure, organizations can detect, respond to, and prevent security threats in a timely and effective manner. Say Cure’s advanced analytics capabilities help organizations identify patterns and trends in their security data, allowing them to quickly respond to security incidents and minimize the impact of threats. The top 5 approaches we can take to achieve the different use cases to implement with SayCure are given below.
Hunting Approaches with SayCure
Failed Logins
While starting off with looking at failed logins, it was a little difficult to look at due to their sheer number. However, we looked for a few things which stand out.
Large numbers of failed logins on a single source within a small number of times.
Many failed logins on single source within a small number of times can indicate attackers attempting to brute force using credentials they have already found.

Failed Login Outside office hours.
Failed logins outside office hours. Mostly the working hours are only Mon-Fri 9-6 but there are a bunch of failed logins from IP Address: x.x.x.x.

Failed Logins by disabled accounts.
To find out login failure from disabled accounts we can look for failure reasons Code 0XC000072 which means that the account is currently disabled. So, we can also detect such activity from SayCure. So, if the attacker tries to login from disabled account, then, we can get alert for such kind of threat activity.
Failed Kerberos pre authentication.
This relates a bit to the previous Event ID as it happens when someone first logs on for the day. Event ID 4771 along with code 0x18. This means ‘pre authentication information was invalid’ or put simply, bad password. Look for large numbers of these coming from a single host. This sort of behavior usually highlights brute force attempts which can be detected through SayCure.
Policy Changes
These Event IDs look at Domain, Kerberos and System Audit Policies being changed. These policies should only be changed by approved users and even then, the changes should happen within change windows or approved times. Look for accounts changing audit policies outside this as this is a common action taken by attackers. We can also detect such activity from SayCure.

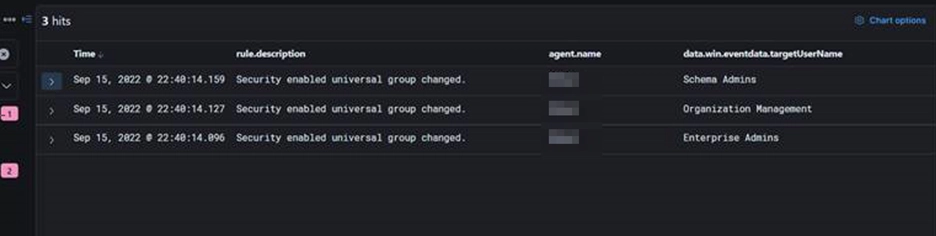
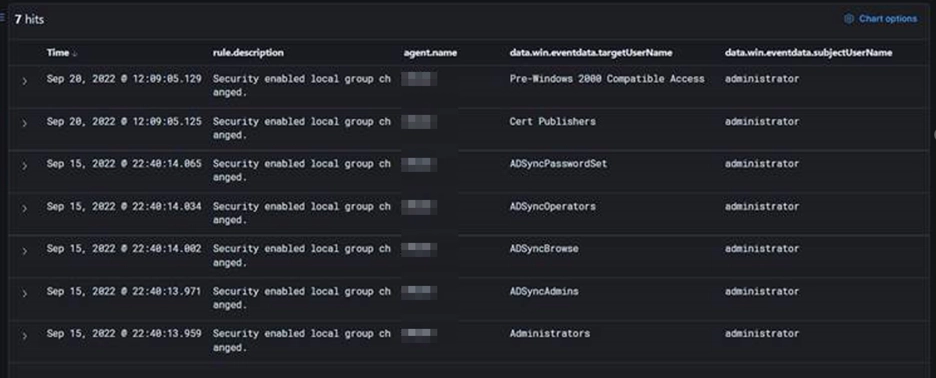
Security Enabled Group Changed
Look for changes being made to any groups you consider ‘Critical’. This could be Domain Admins, SQL Admins, financial users, or anything else your business deems important. The main thing here is to look for changes being made to any critical groups and ask why. Any modifications being made to important groups should have relevant documentation saying why – if they don’t, this is a massive red flag. Such activity can be detected through our SayCure Platform.
Conclusion
Windows Event Logs is an effective method for detecting and responding to security threats in an organization’s IT environment. By leveraging the rich information contained in event logs, security analysts can proactively identify anomalous activity, investigate potential security incidents, and take appropriate remediation actions.
I have listed just few of the event ids which are important to monitor in windows. I did not list all of the security related events because as a SOC Analyst I think some event ids produce too many false positives when detecting threats, and better value can be obtained by investigating the above event ids. Although this is not a complete list of all the events, it might be a fantastic place to start if you want to learn more about event logs and grow more accustomed to them. It should be much easier to broaden your understanding of event logs.
Overall, implementing a threat hunting program that leverages Windows Event Logs can help organizations improve their security posture by proactively identifying and responding to potential security incidents before they cause damage. By continuously monitoring and analyzing event logs, organizations can stay one step ahead of threat actors and better protect their critical assets and data